The Total Crypto Market Cap (TOTALCAP) and the Bitcoin (BTC) price have generated bearish divergence. The Huobi Token (HT) price fell below a horizontal resistance area.
In the news, Sam Bankman-Fried is fighting a subpoena that would require him to take part in a remote deposition. While Coinbase beat its earnings expectations, its CFO did not rule out further job cuts. And Iceland became the largest Bitcoin hash rate producer per capita.
Crypto Market Cap (TOTALCAP) Holds Above Support
The crypto market cap (TOTALCAP) broke out from the $1.04 trillion resistance area on Feb. 15. It validated it as support over the next two days, bouncing to a high of $1.1 trillion on Feb. 21.
However, TOTALCAP began another downward movement after the daily RSI generated bearish divergence. Nevertheless, the crypto market cap is still above the $1.04 trillion area.
Whether it breaks down or bounces could determine the future trend’s direction. A breakdown could lead to lows near $960 billion while a bounce could lead to a high of $1.16 trillion.
Bitcoin (BTC) Falls Below Resistance
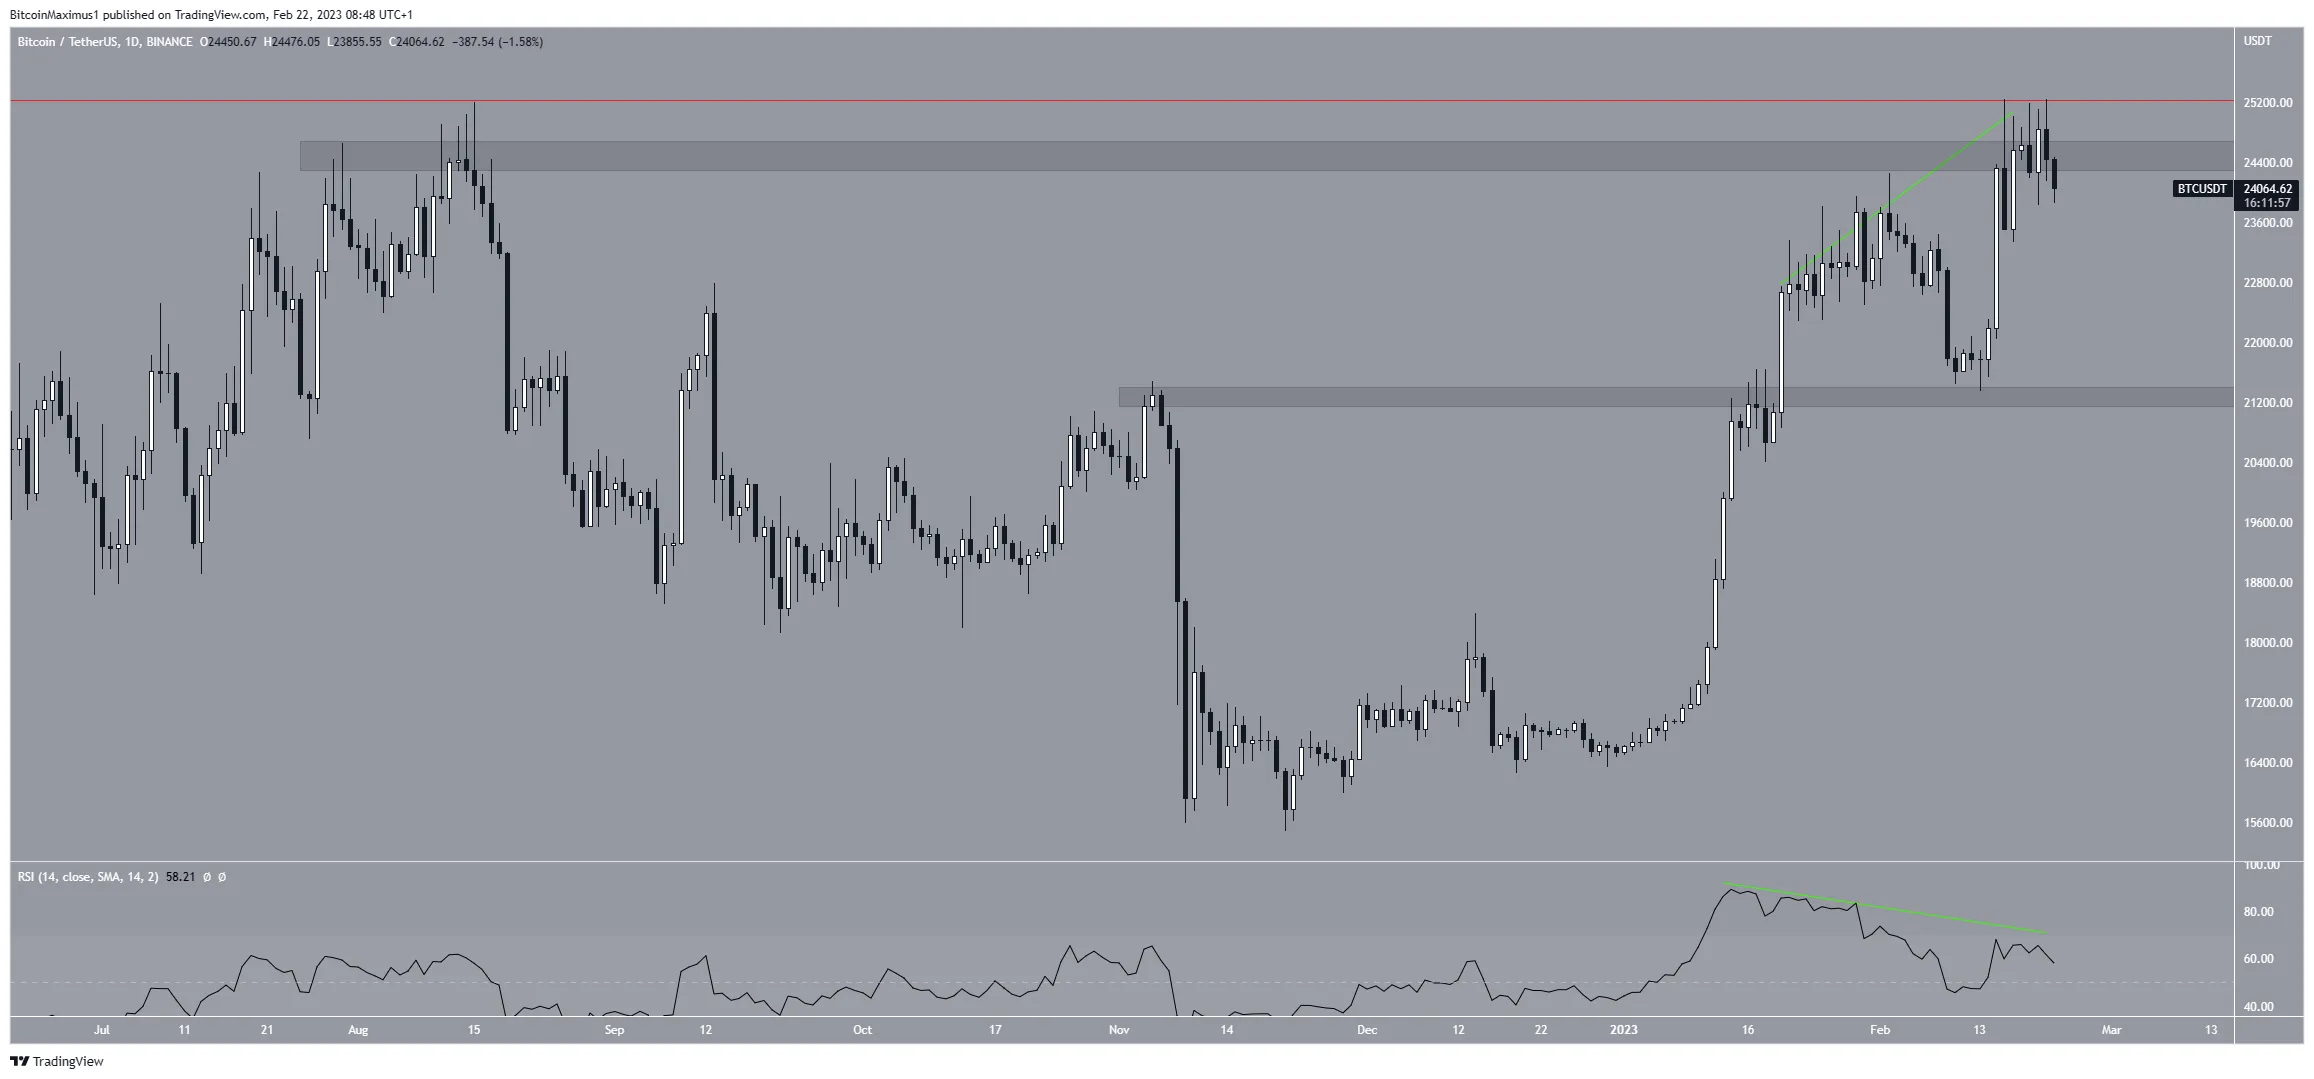
The Bitcoin price also generated bearish divergence after briefly moving above the $24,500 resistance area. Now, the price is back below it once more.
If the Bitcoin price reclaims the $24,500 area, it could increase toward $28,000. However, if it fails to do so, a fall to $21,250 could follow.
It is worth mentioning that the Bitcoin price has already moved above its August 2022 highs (red line)

Huobi Token (HT) Loses Momentum
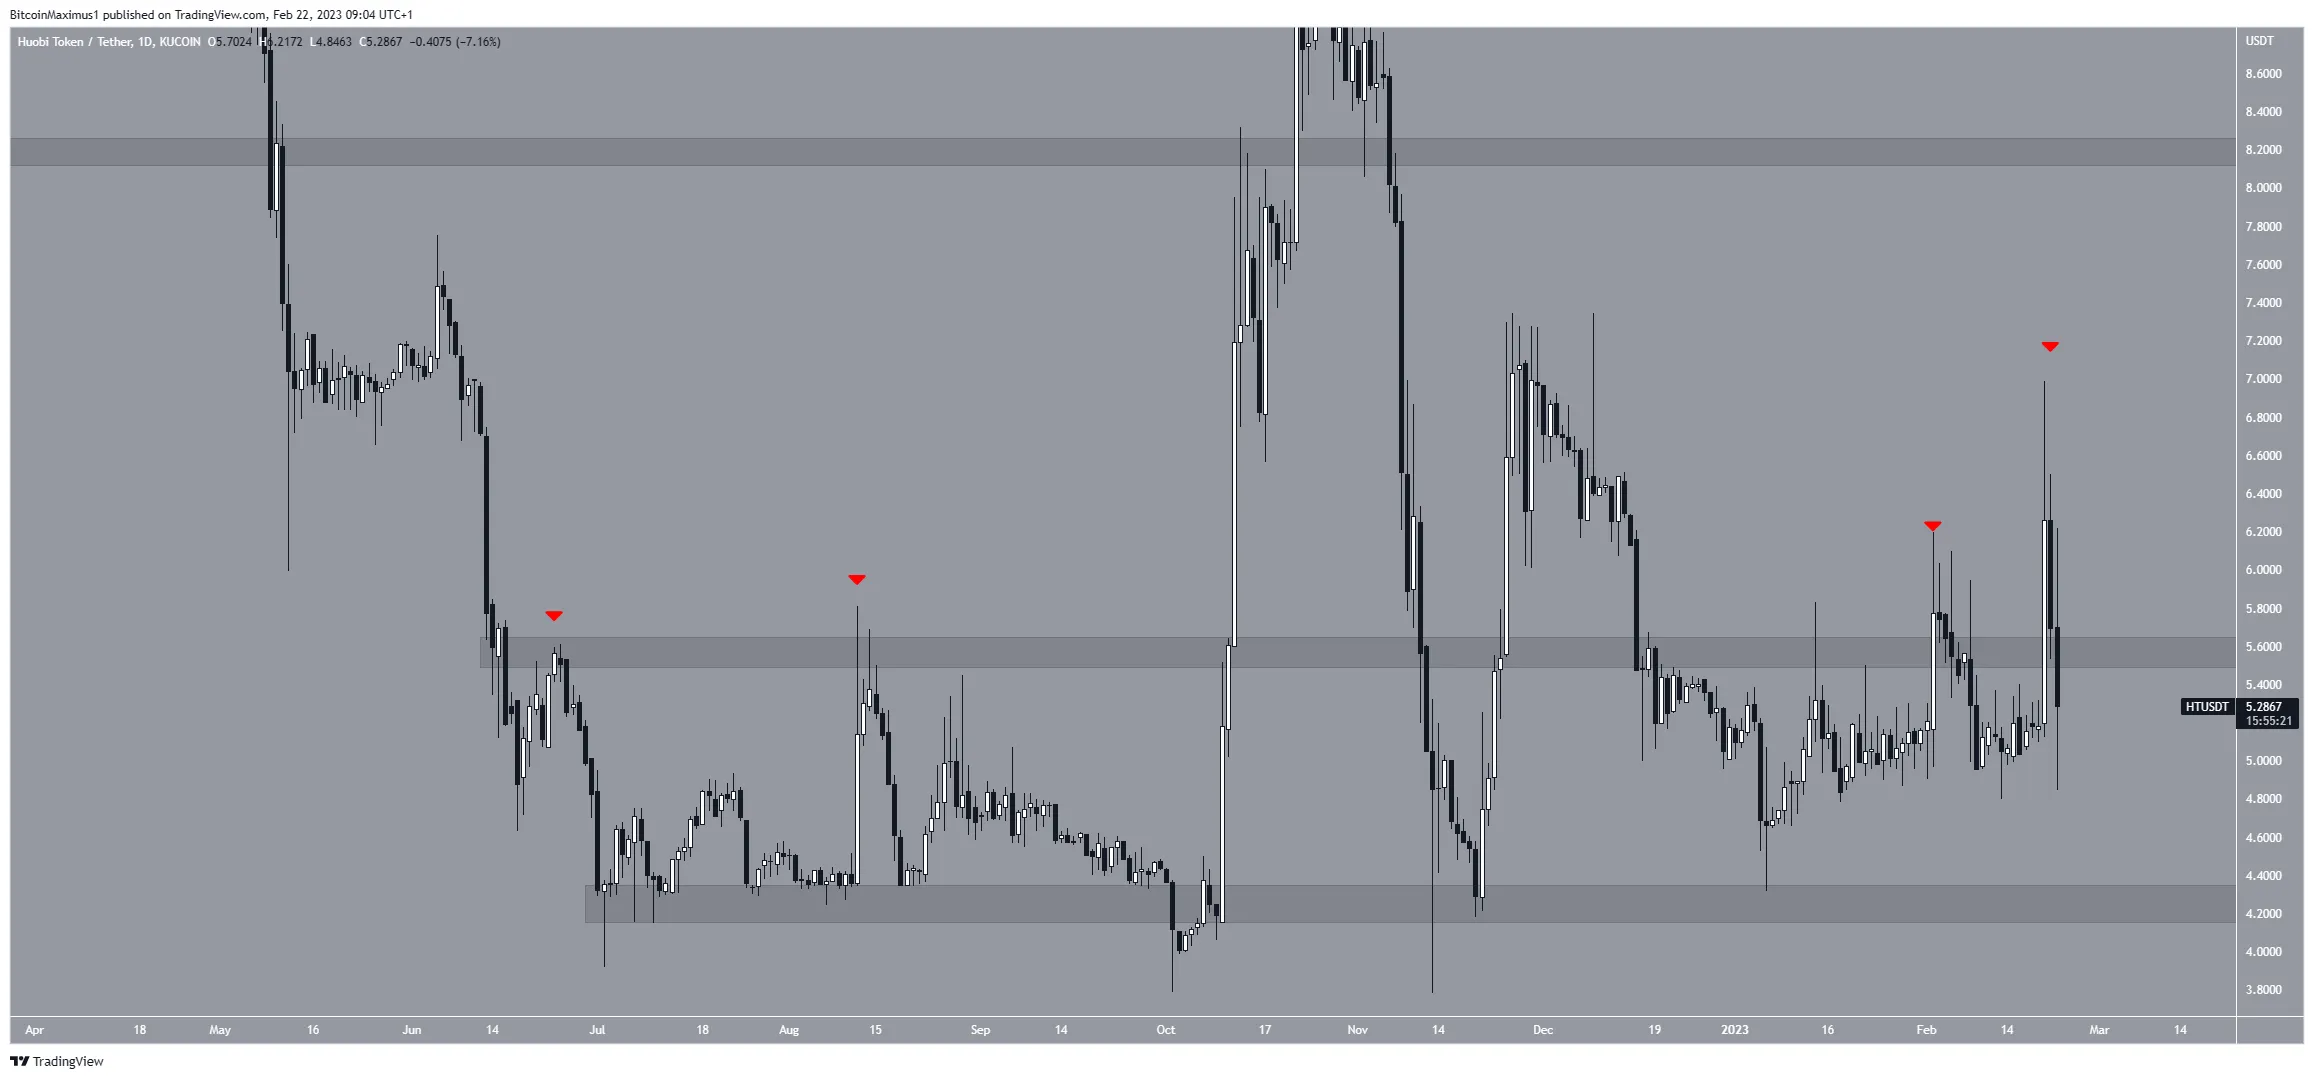
The Huobi Token (HT) price fell sharply after reaching a high of $6.99 on Feb. 20. This created a long upper wick (red icon) and caused it to drop below the $5.30 resistance area.
Unless the price reclaims this area, the trend is considered bearish. Therefore, a drop toward $4 would be expected.
If the HT price moves above $5.40 instead, it could increase to $8.40.

Disclaimer
BeInCrypto strives to provide accurate and up-to-date information, but it will not be responsible for any missing facts or inaccurate information. You comply and understand that you should use any of this information at your own risk. Cryptocurrencies are highly volatile financial assets, so research and make your own financial decisions.


