The Cosmos (ATOM) price shows signs of a completed correction which could lead to a sustained upward movement.
The weekly chart for ATOM shows that the price is trading in a long-term range between $8.90 and $15.60. The range has been in place since ATOM moved above $8.90 at the beginning of July 2022. Since then, the range’s top and bottom have been validated sufficient times.
Currently, the ATOM price trades very close to the $15.60 resistance area after it was rejected by it (red icon).
Despite the rejection, the weekly RSI is bullish. It has broken out from a descending resistance line and is above 50. Both of these are considered bullish signs.
If a breakout occurs, the ATOM coin price could increase to the next resistance at an average price of $22. However, if it fails to do so, the ATOM price could fall to the $8.60 support area.
Cosmos (ATOM) Price Prediction for March: Reversal is Right Around Corner
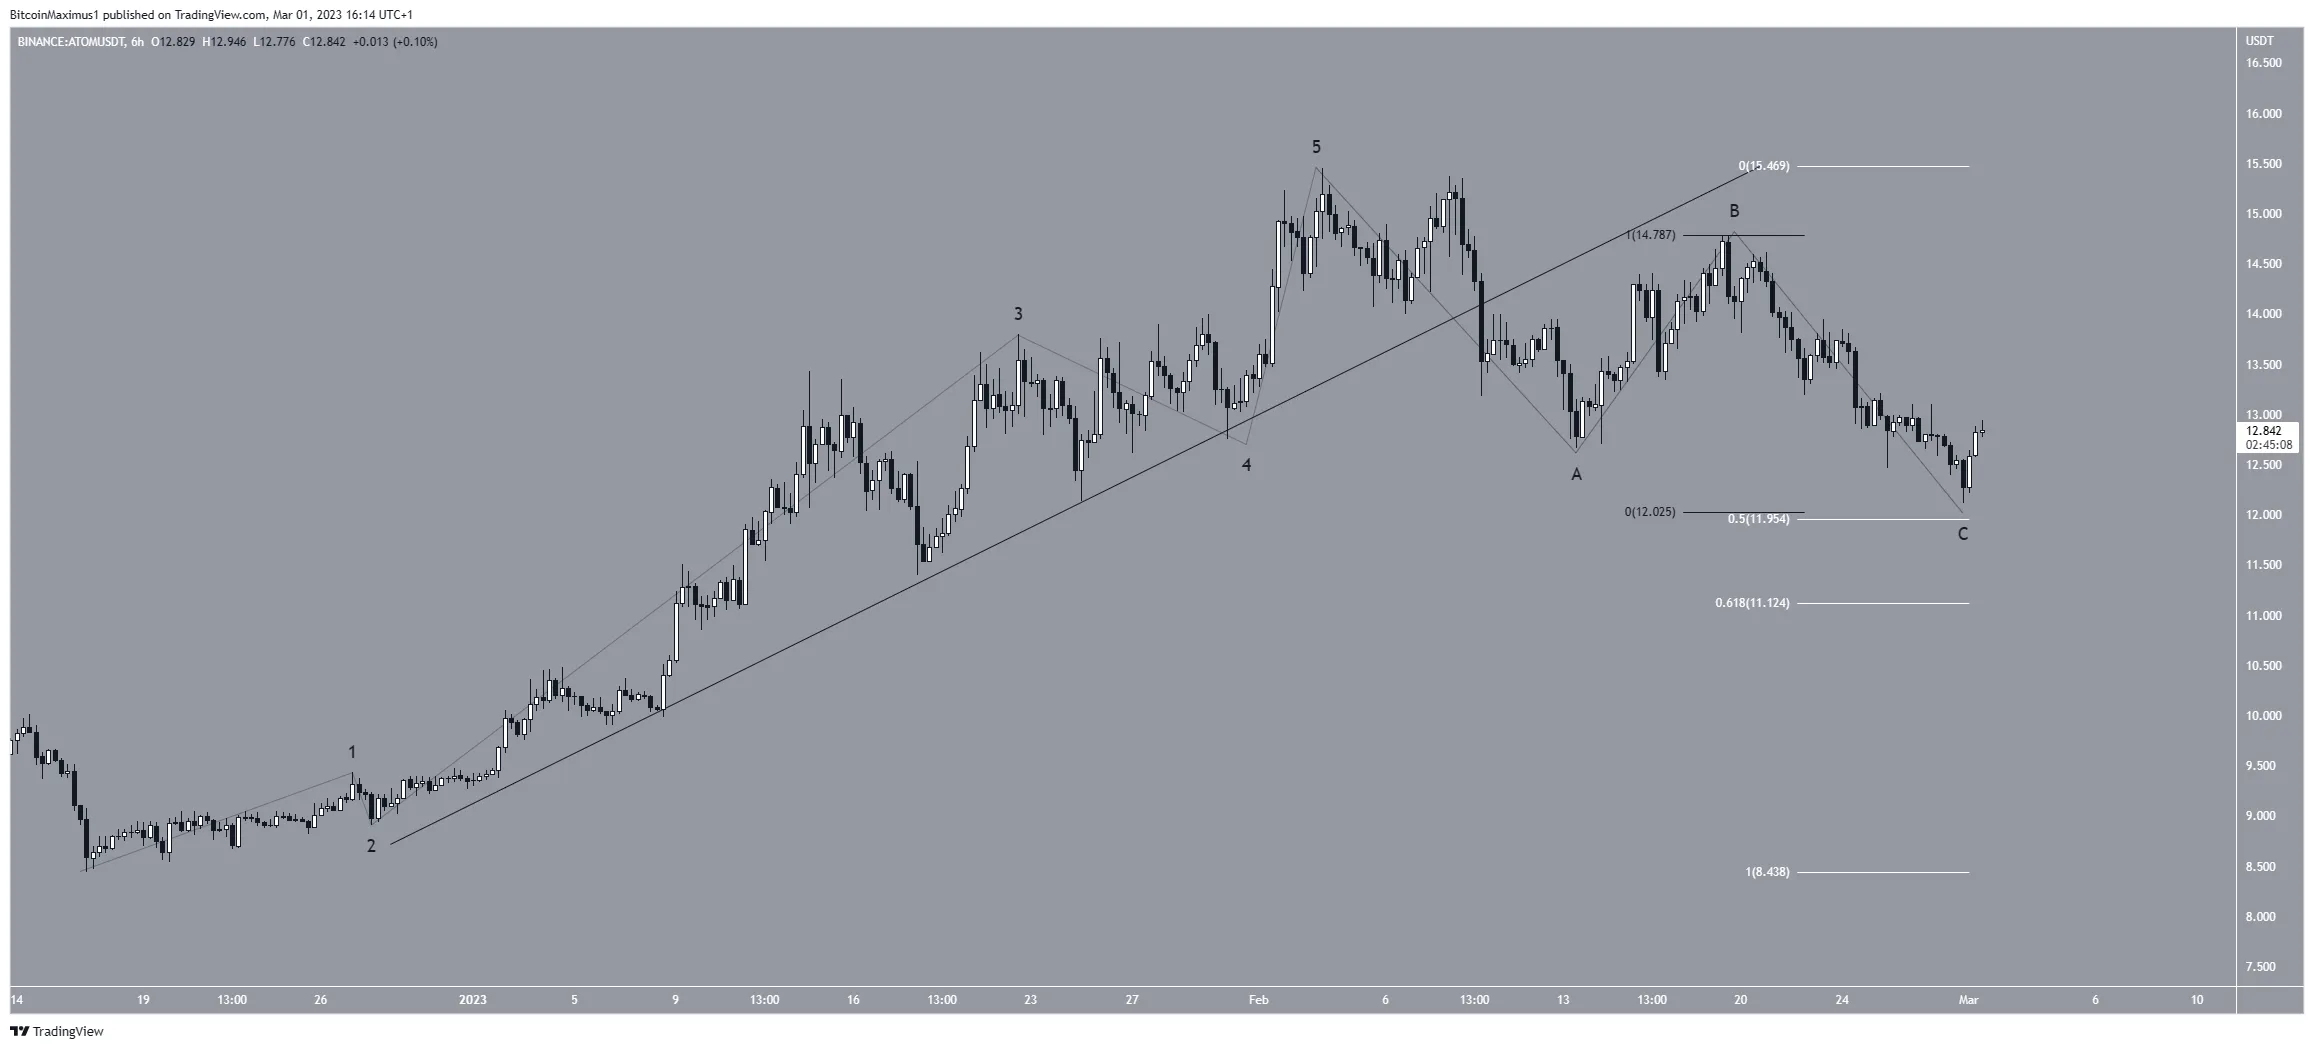
The technical analysis from the short-term six-hour chart shows that the ATOM token broke down from an ascending support line. Afterward, it initiated a relief rally before falling again.
When combining this with the wave count, it is possible that the price completed a five-wave upward movement (black), which was confirmed by the breakdown from the support line. If so, the price is currently in wave C of an A-B-C correction.
The most likely level for the wave to end would be between $11.95 – $12. This confluence of supports is created by the 0.5 Fib retracement support level and by giving waves A:C a 1:1 ratio. So, the correction may be complete. In this case, the Cosmos price would be expected to increase above $15.45 and go toward $22.
Since corrections usually end at or above the 0.618 Fib retracement support level, a close below $11.12 would put the bullish count at risk. Additionally, a fall below the $8.43 minimum price would definitely invalidate the long-term bullish Cosmos price forecast and could send the ATOM price toward $5.

To conclude, the most likely Cosmos price prediction for March is an increase toward the yearly high of $15.45 and a potential breakout toward $20. On the other hand, a close below $11.12 could put this count at risk. Then, it could potentially cause a drop to $8.43.
For BeInCrypto’s latest crypto market analysis, click here.
Disclaimer
BeInCrypto strives to provide accurate and up-to-date information, but it will not be responsible for any missing facts or inaccurate information. You comply and understand that you should use any of this information at your own risk. Cryptocurrencies are highly volatile financial assets, so research and make your own financial decisions.


