Litecoin (LTC) price has increased over the past five days. Despite this increase, it is uncertain whether a reversal has begun or if LTC is in a relief rally.
The Litecoin (LTC) price has fallen under a descending resistance line since reaching a high of $413.49 in May 2021. The line rejected the price in February (red icon), initiating the current downward movement.
Last week, the LTC price bounced at the $68 support area (green icon), validating it and creating a long lower wick (green icon). This is considered a sign of buying pressure. Moreover, the weekly RSI bounced at 50, another bullish sign.
If the price breaks out, the main resistance area would be at $105. This is the final resistance before $270. Therefore, if the LTC price breaks out above it, it could greatly accelerate the rate of increase.
However, if the resistance line rejects the price, another test of the $68 support area would be in the cards.
Litecoin (LTC) Price Movement – Relief Rally or Reversal?
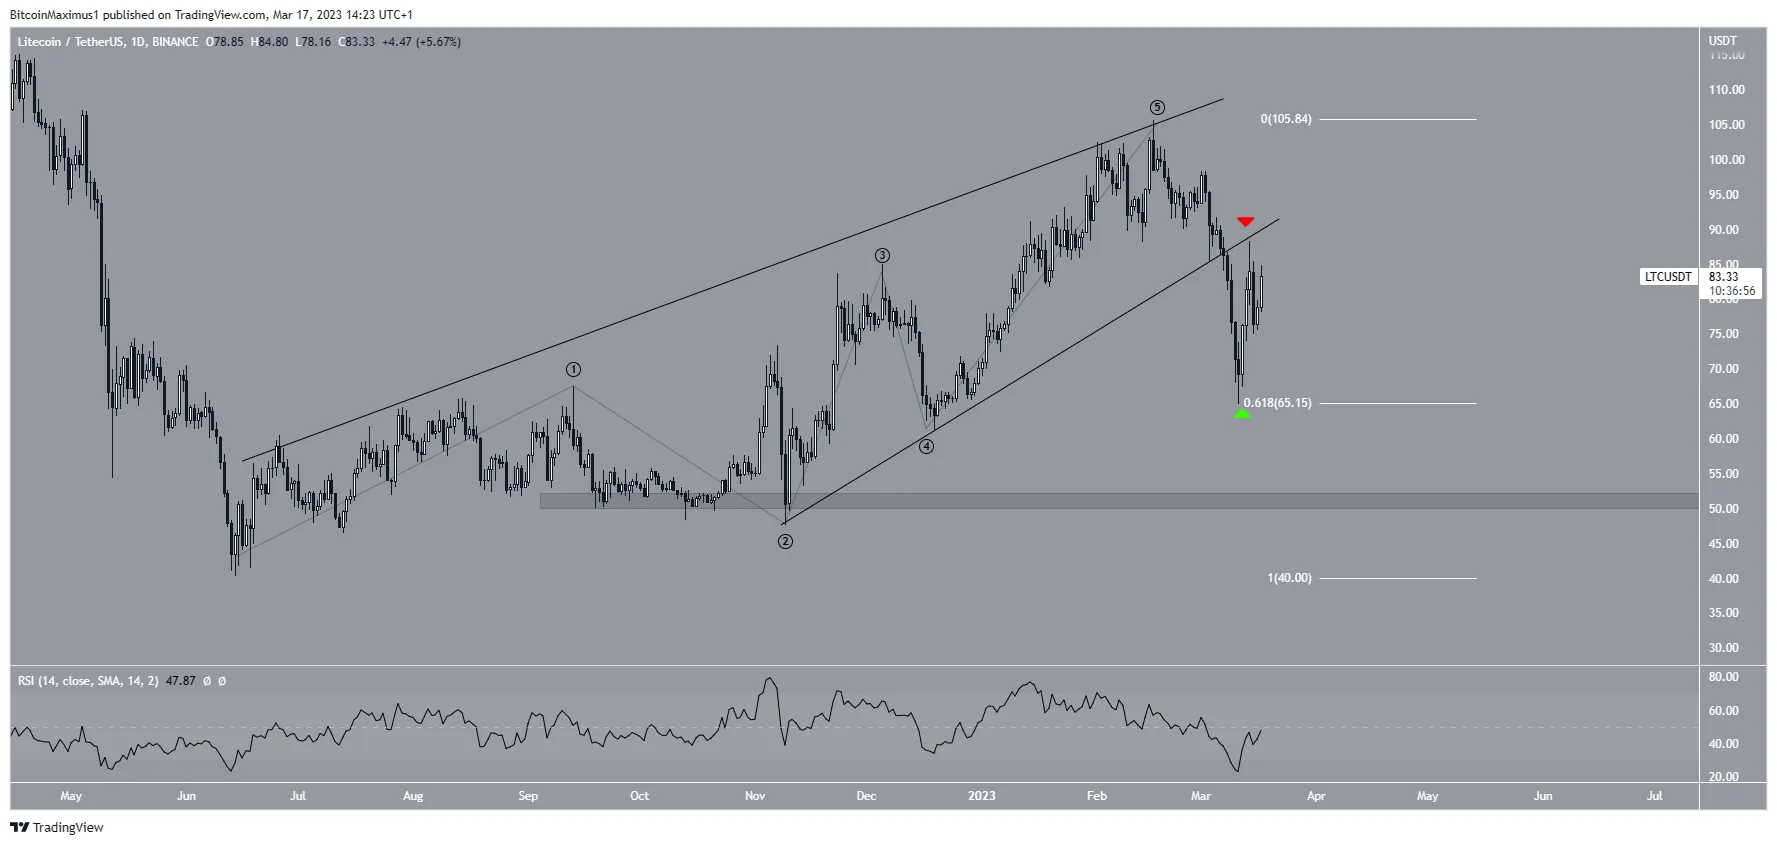
The technical analysis from the daily time frame provides a mixed outlook. The Litecoin price has broken down from an ascending wedge and could be in the process of validating it as resistance (red icon).
Moreover, the daily RSI has fallen below 50, a sign of a bearish trend. The LTC price seems to have completed a five-wave upward movement, which took the shape of a leading diagonal.
Afterward, the digital asset bounced at the 0.618 Fib retracement support level (green icon). It is uncertain if the bounce is just a relief rally or if the correction is already complete.
In case the correction is complete, the LTC price would be expected to break out above the resistance line and the $115 area. Then, it could increase toward $275. However, if this is only the first part of the correction, the price could fall to the $52 support area. The next 24 hours could be crucial in determining which is the correct outlook.

To conclude, whether the LTC price reclaims the support line of the previous wedge could determine the future trend. If it does, the price could break out from the long-term descending resistance line. If it gets rejected, a fall toward $52 could follow.
For BeInCrypto’s latest crypto market analysis, click here.
Disclaimer
BeInCrypto strives to provide accurate and up-to-date information, but it will not be responsible for any missing facts or inaccurate information. You comply and understand that you should use any of this information at your own risk. Cryptocurrencies are highly volatile financial assets, so research and make your own financial decisions.


