The Algorand (ALGO) price is trading at an important confluence of resistance levels. Whether it breaks out or gets rejected could determine the future long-term trend.
ALGO is the native cryptocurrency of the Algorand blockchain network. The weekly chart shows that the ALGO price has fallen since reaching an all-time high of $2.99 in November 2021. The decrease culminated with a low of $0.159 on Dec. 26.
While the price bounced afterward, it failed to break out from the resistance area. It is currently in the process of creating a higher low.
While the RSI is increasing, it is still below 50. As a result, it provides no direction for the future trend.
If the ALGO price breaks out, it could increase to the closest resistance area at $0.20. However, if it fails to do so, a retest of the $0.159 low could transpire.
Algorand (ALGO) Reaches Make-or-Break Level
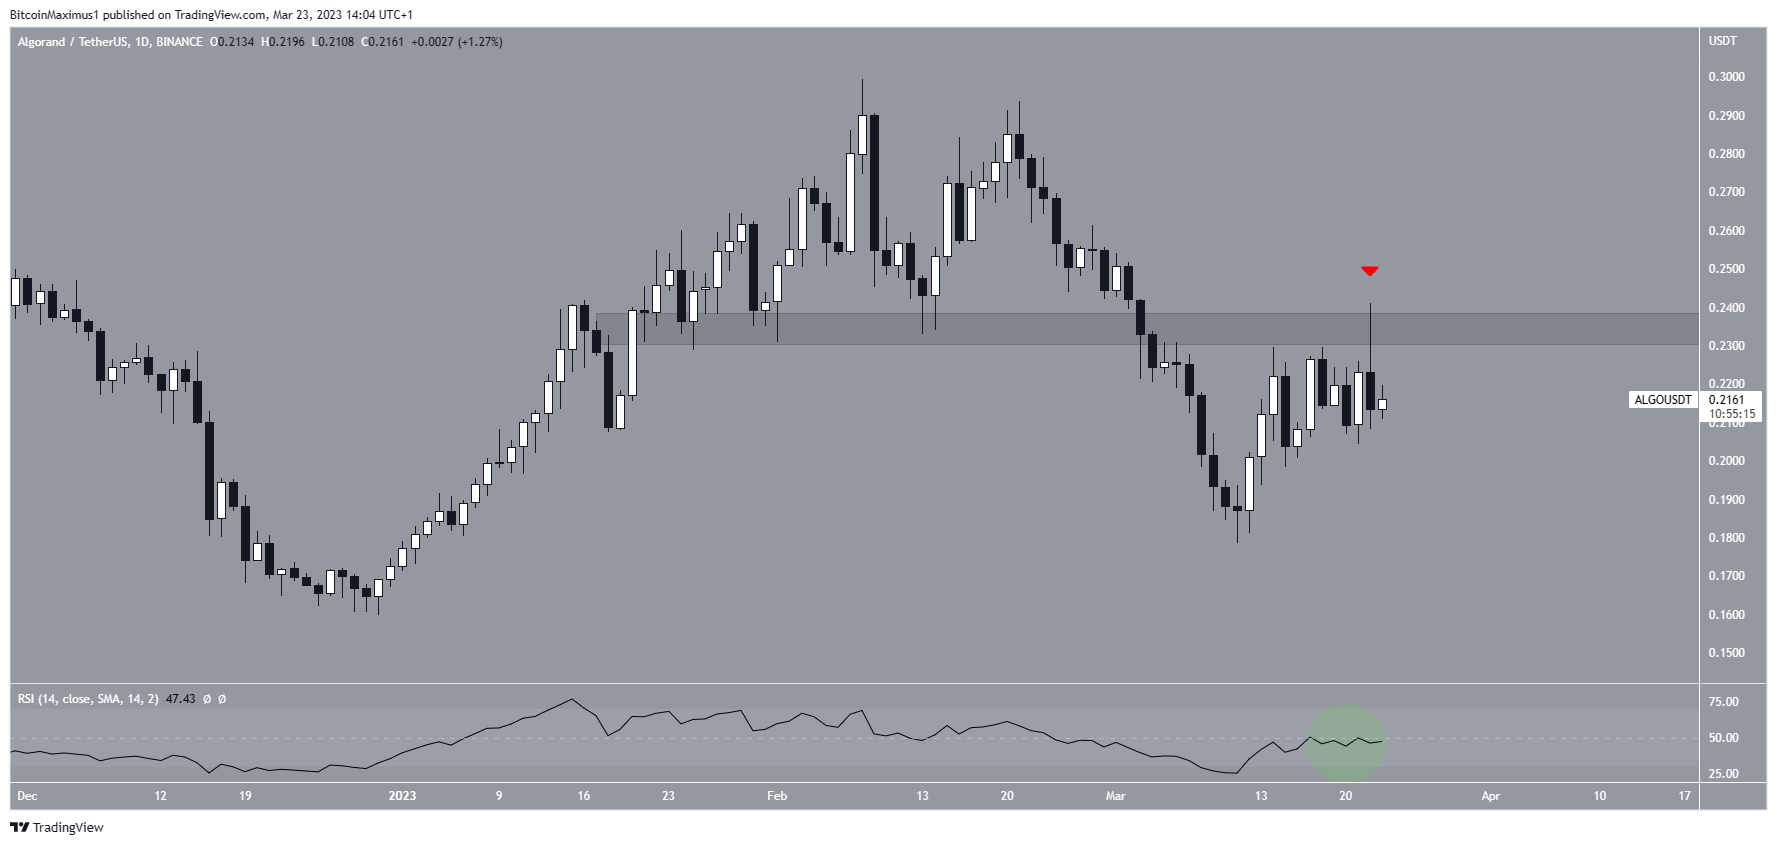
The technical analysis from the daily time frame shows that the Algorand price has fallen since creating a lower high on Feb. 21. While the price initiated a bounce on March 11, this culminated with a shooting star candlestick on March 22 (red icon) and a decrease over the next 24 hours. It also validated the $0.235 resistance area. Finally, the rejection coincided with an RSI rejection from the 50 line.
As a result, it is possible that the upward movement is complete and a drop will follow.

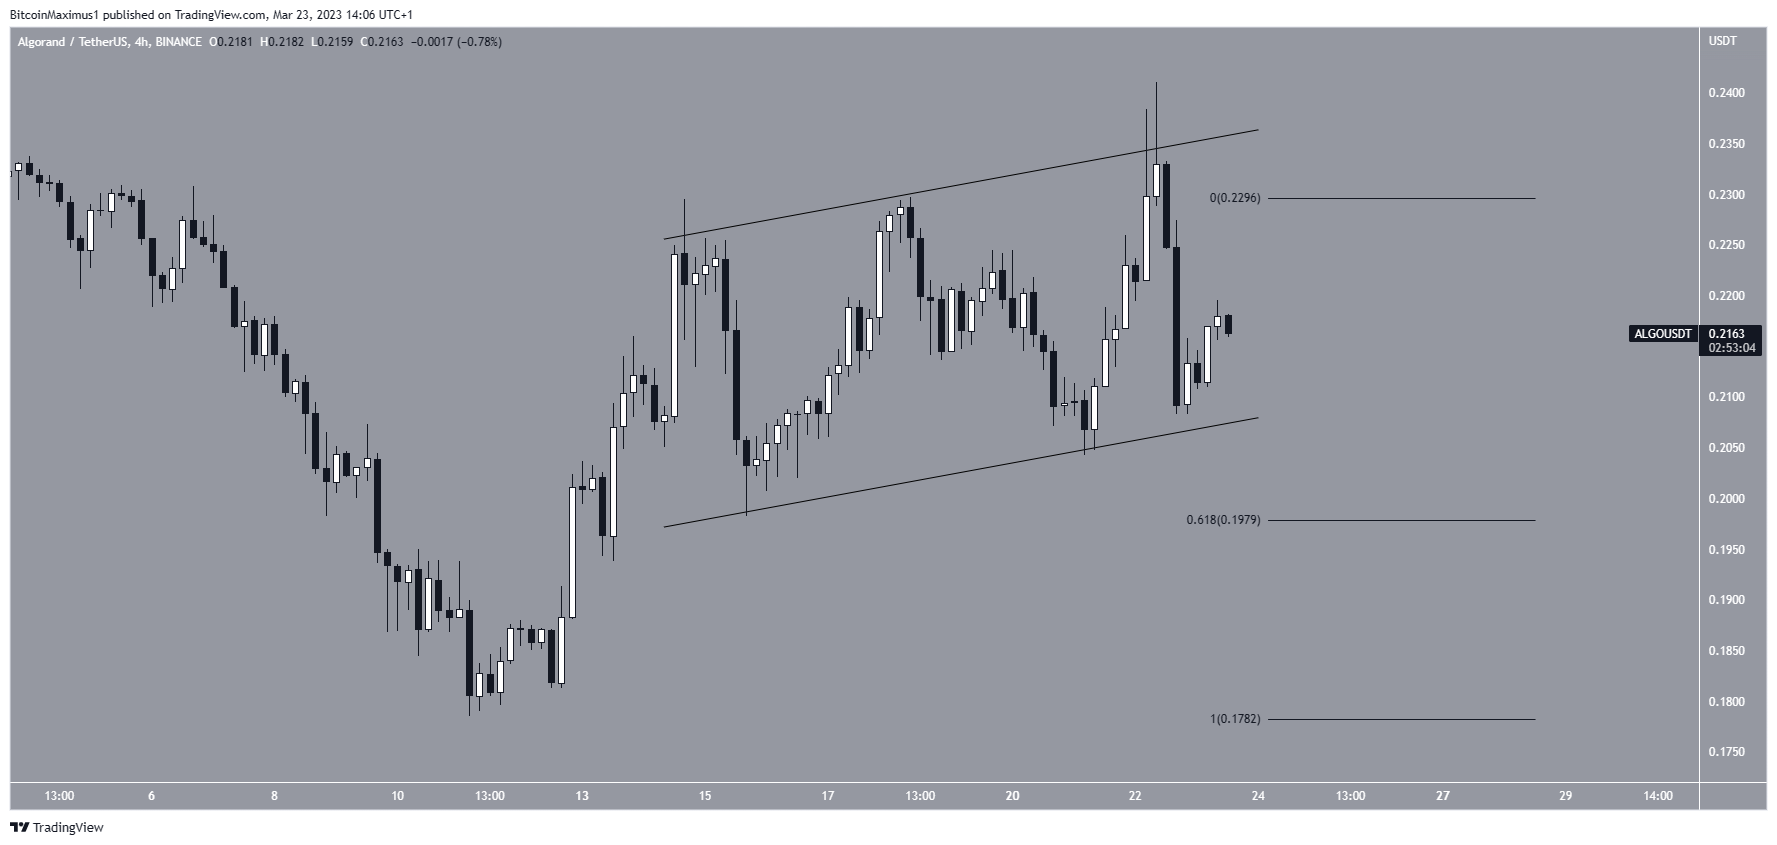
This possibility is also supported by the ascending parallel channel in the four-hour time frame. Such channels often contain corrective movements, meaning that a breakdown from it is expected.
In that case, the ALGO price could fall to the 0.618 Fib retracement support level at $0.198.
On the other hand, a breakout from the channel would invalidate this bearish forecast, indicating that the trend is bullish. In that case, the digital currency would also break out from the long-term resistance line. As a result, an increase to $0.40 could follow.

To conclude, there is a confluence of resistance levels between $0.23-$0.24, created by a short-term ascending parallel channel, a horizontal resistance area, and a long-term descending resistance line. Whether the price breaks out above this region or gets rejected could determine the future trend. A rejection would likely lead to a fall toward at least $0.198, while a breakout could lead to a 100% increase toward $0.40.
For BeInCrypto’s latest crypto market analysis, click here.
Disclaimer
BeInCrypto strives to provide accurate and up-to-date information, but it will not be responsible for any missing facts or inaccurate information. You comply and understand that you should use any of this information at your own risk. Cryptocurrencies are highly volatile financial assets, so research and make your own financial decisions.


