These two renowned crypto traders have been vocal about their bearish outlook for the Bitcoin (BTC) price and the rest of the crypto market. Both provide different reasoning for their beliefs.
Crypto Capo Believes Move is Manipulated
Well-known crypto trader @CryptoCapo, after being inactive for over a month, tweeted that he still believes that the trend is bearish and new lows below $16,000 will follow. He gives two reasons for this:
- Firstly, altcoins are at major resistance.
- Secondly, the move is manipulated with BUSD and USDC.
While it is possible to analyze the first claim by looking performing a technical analysis of the cryptocurrency market, the second one seems to lack evidence to back it up, since his trading strategies are not included in the tweet.
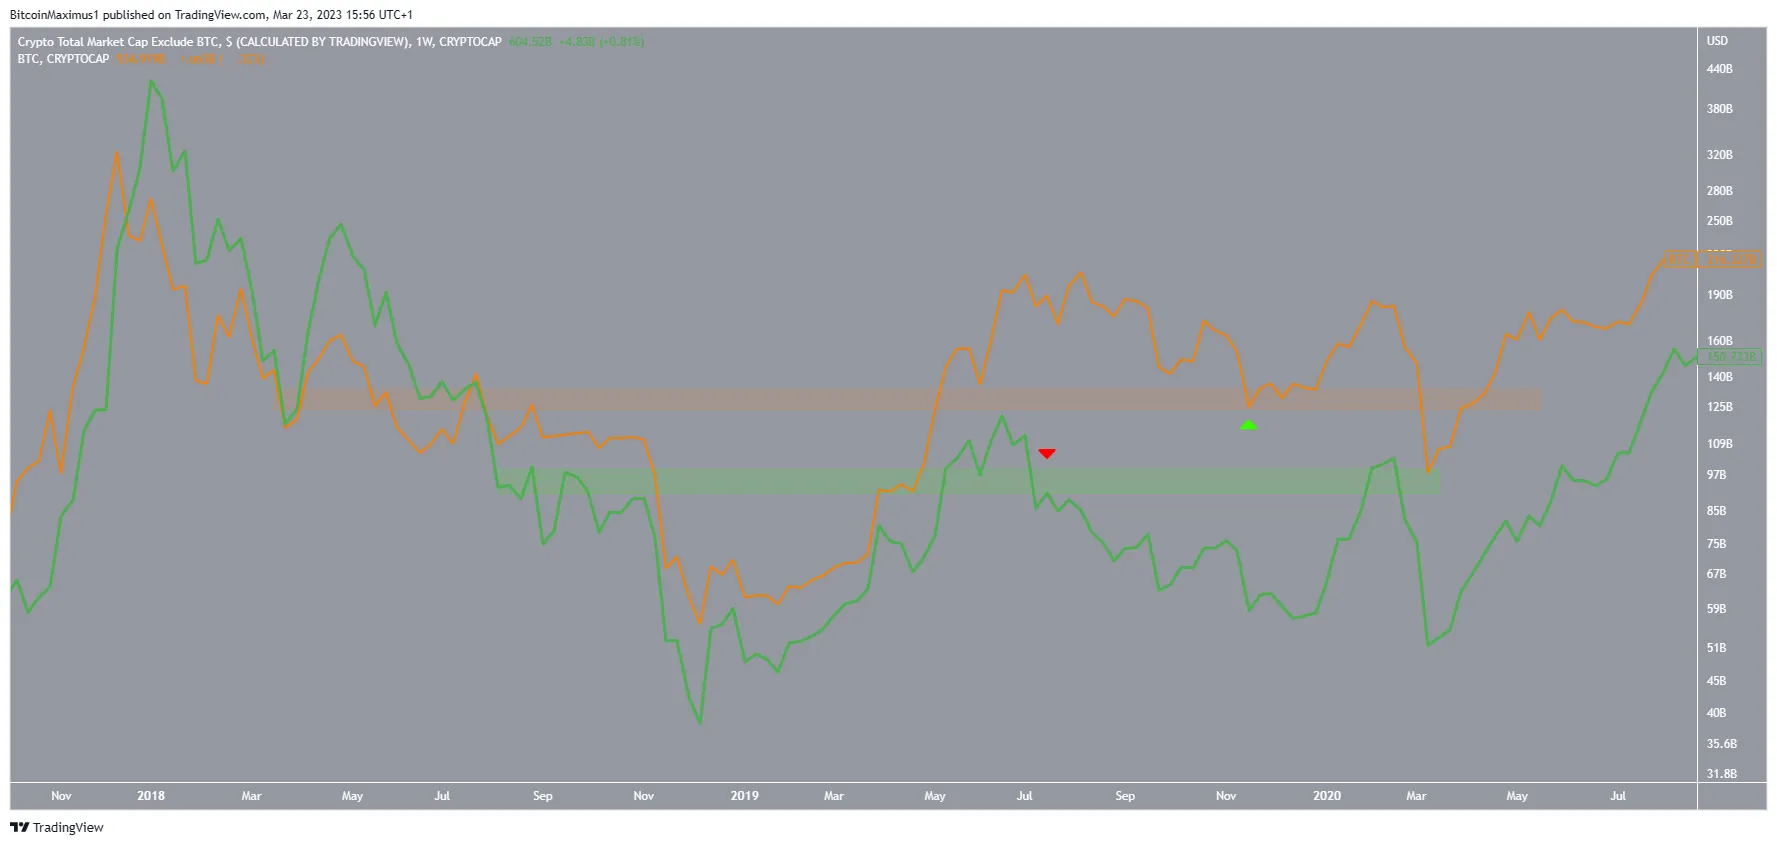
When excluding Bitcoin (BTC), the altcoin market cap (ALTCAP) is indeed trading at the 605 billion resistance area. While ALTCAP increased above it several times, it failed to reach a close above the area.
However, the daily RSI has broken out from its bearish divergence trend line (green). This often precedes significant bullish trend reversals. As a result, it is possible that ALTCAP will break out and increase toward the $680 billion resistance area. If not, ALTCAP could fall to the $518 billion support area again.
In any case, there have been instances in the past where the Bitcoin price has broken out above a key resistance area (green icons) while the altcoin market cap (green) has fallen below a support level (red icon). This was especially visible during the recovery in 2019. As a result, it may not be accurate to draw conclusions for the bearishness of the Bitcoin price by looking at the altcoin market cap.

Profit Blue Believes Bitcoin (BTC) CME Gap Will Be Filled
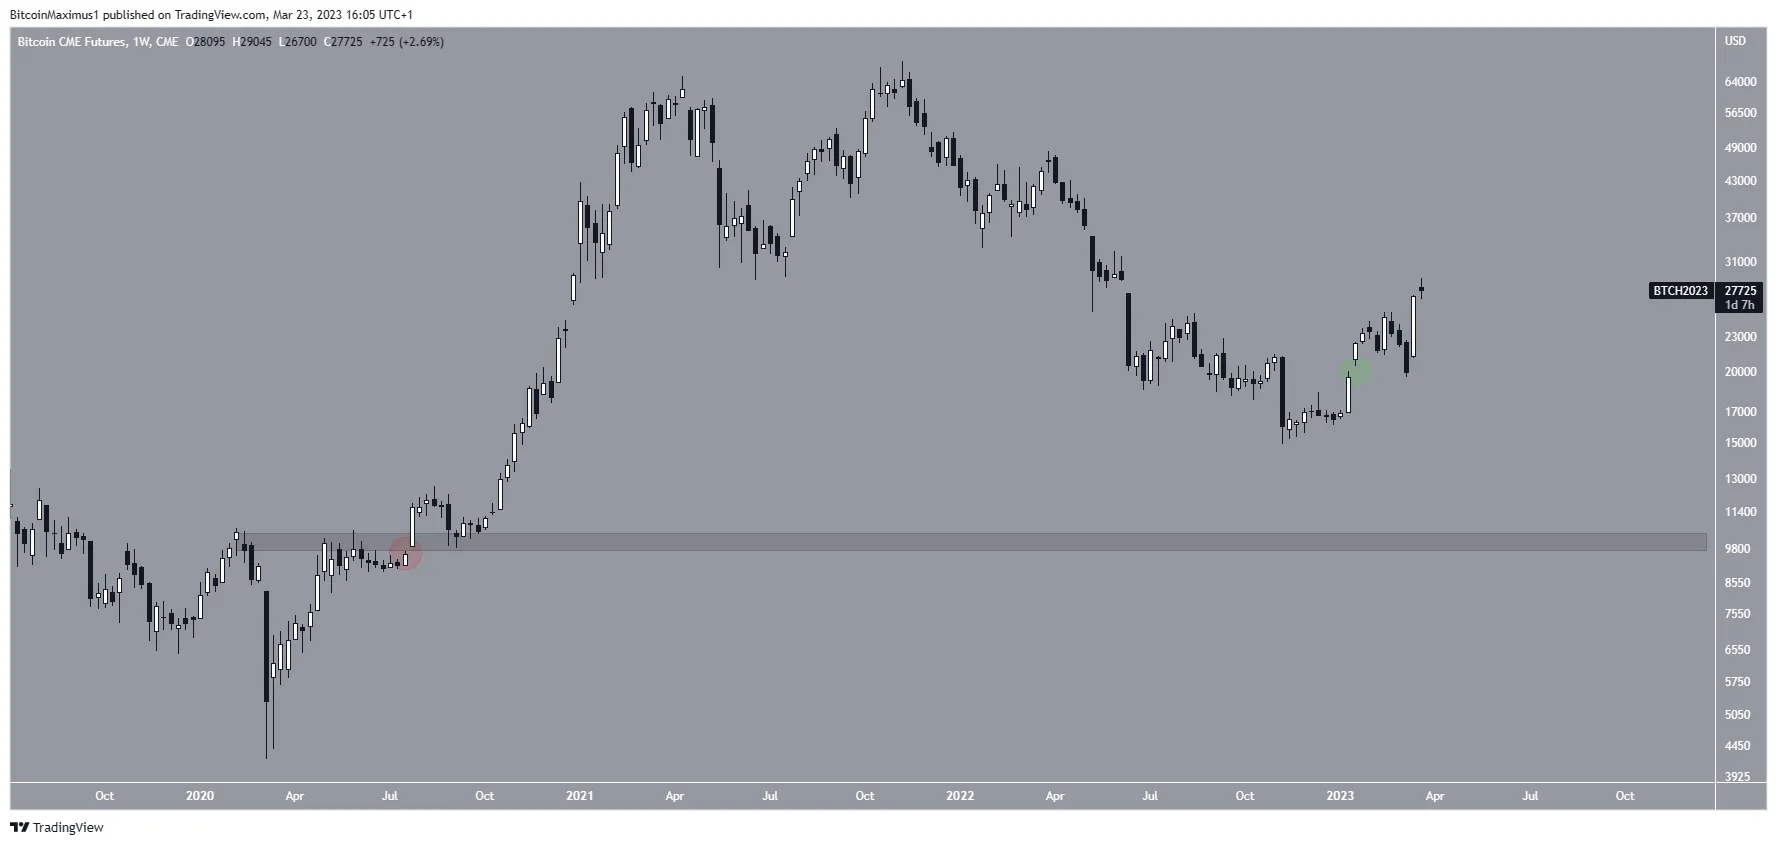
Well-known cryptocurrency trader @profit8lue states that a retest of the $10,000-$11,000 area will occur because there is a CME gap there that needs to be filled. The gap refers to the difference between the closing price of Bitcoin futures on the Chicago Mercantile Exchange (CME) on a Friday and the opening price on the following Monday.
However, it is worth mentioning that the March 6-13 decrease filled the most recent CME gap (green circle). The gap in the tweet is a very small gap (red circle) that has been there since September 2021. It also coincides with the $10,000 support area, which is the closest one if the digital asset breaks down below the current lows. As a result, if the Bitcoin price were to fall below $16,000, it could very well reach this area.
However, there are no immediate signs that indicate this will occur.

For BeInCrypto’s latest crypto market analysis, click here.
Disclaimer
BeInCrypto strives to provide accurate and up-to-date information, but it will not be responsible for any missing facts or inaccurate information. You comply and understand that you should use any of this information at your own risk. Cryptocurrencies are highly volatile financial assets, so research and make your own financial decisions.


