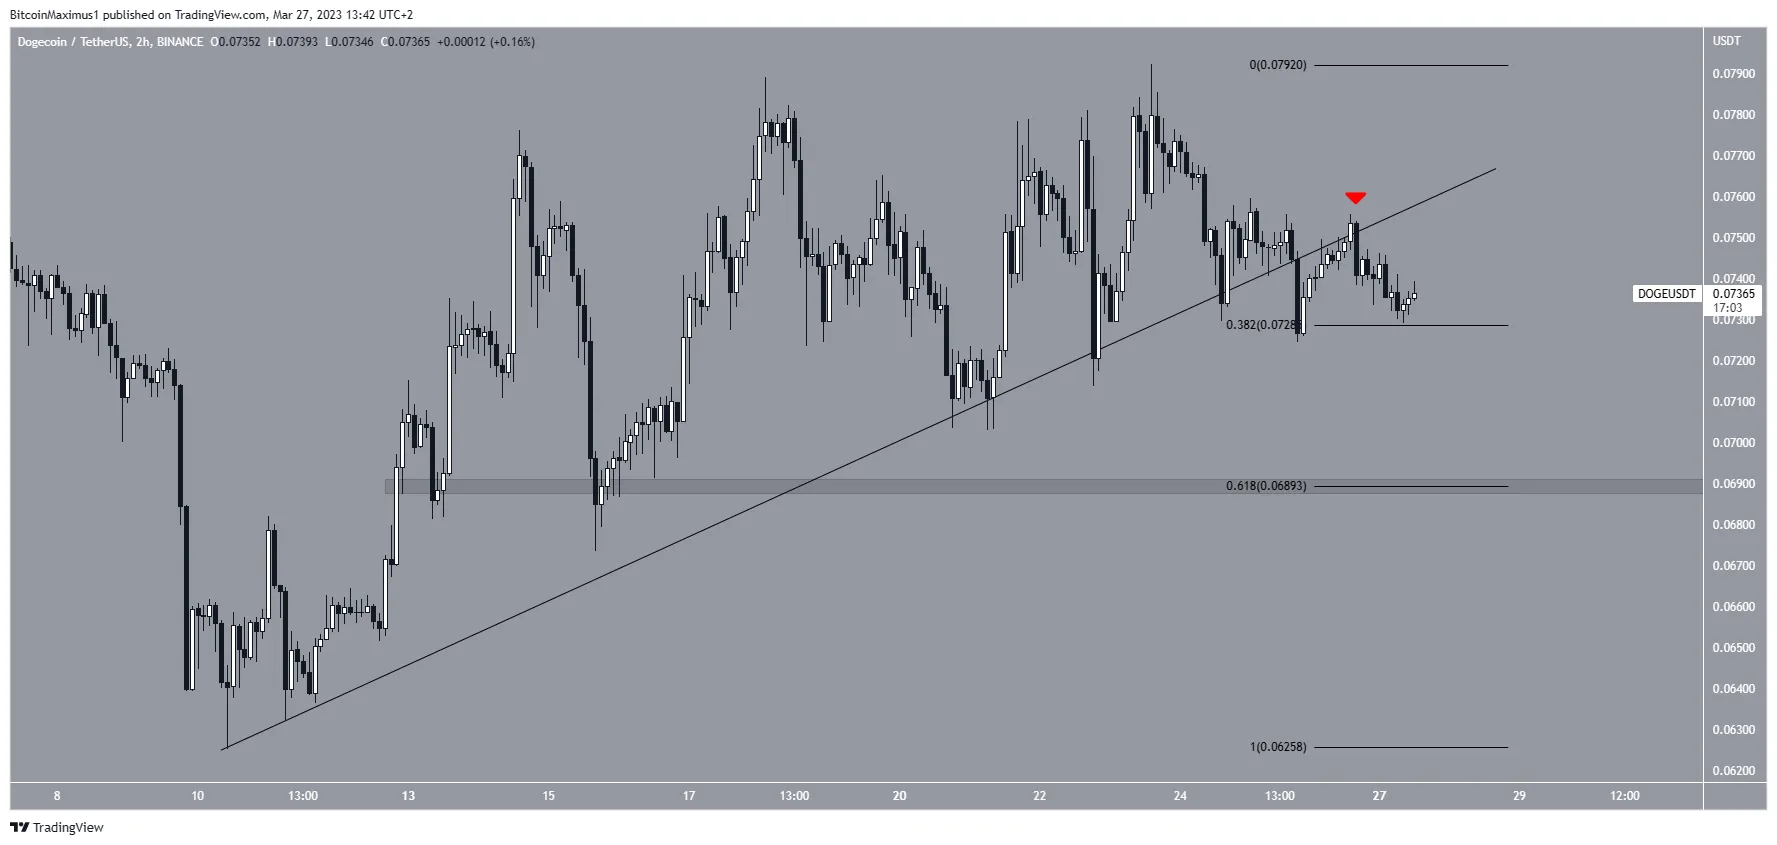
The Dogecoin (DOGE) price has lost its momentum after a previous breakout. Additionally, it fell below its short-term bullish structure.
The Dogecoin (DOGE) price has increased since March 10. Shortly afterward, it reclaimed the $0.068 support area and broke out from a resistance line that had been in place since November 2022. Breakouts from such long-term structures usually lead to significant upward movements.
This possibility is also supported by the deviation (green circle) and subsequent reclaim of the $0.068 support area. If the increase continues, the next closest resistance area would be at $0.100, created by the 0.382 Fib retracement resistance level and a horizontal resistance area. The area also coincides with the highest price of the year.
However, the daily RSI does not confirm the legitimacy of the breakout yet. This is because the indicator has not moved above 50 yet. Moreover, the internet meme coin still trades close to the breakout level. As a result, it is not certain if the trend is bullish or if the breakout was illegitimate.
Dogecoin (DOGE) Price Loses Short-Term Structure
The technical analysis from the short-term two-hour chart shows that the price broke down from an ascending support line on March 25 and validated it as resistance over the next 24 hours (red icon). The line had been in place since the upward movement began on March 10. As a result, the breakdown from it may mark the end of the short-term upward movement.
Currently, the DOGE price trades above the 0.382 Fib retracement support level at $0.072. If it breaks down, the price could fall to the 0.618 Fib retracement support level at $0.069. This also aligns with the long-term support area mentioned above. The long-term trend can be considered bullish as long as the Dogecoin price trades above it.

To conclude, the most likely DOGE price forecast is a breakdown from the minor support at $0.072 and a decrease to $0.069. However, if the price reclaims the previous ascending support line, it could increase to $0.100.


